2025 Campaign Report
March 1 to May 31, 2025
Prepared by
March 1 to May 31, 2025
Prepared by
Advertising is credited with $574,063 of ticket sales, on $75,152 of tracked spend.
Why there are two numbers. Four platforms can measure themselves: Facebook and Instagram, Google, TikTok and programmatic. Between them they took $75,152 and traced $574,063 in ticket sales, which is 7.6 times back. But you spent $86,883 in total. The other $11,731 went to billboards, Bandsintown and text messaging, and only Bandsintown can report revenue, at $22,256. Put every dollar in the bottom of the sum and every traceable dollar in the top and the honest all-in figure is 6.9 times. We are giving you both because a report that quietly divides by the smaller number is flattering itself.
And the bigger caveat. The event sold $3.36 million in tickets. We are not claiming advertising did all of that, and any report that does is selling you something. Most of that money walked in because Reba, Jelly Roll and Tim McGraw were on the bill, because the press covered it, and because this board has spent years building the thing. That part is real and it is not ours.
Three steps, each one measured. Every number comes from a platform that served an ad and then saw a ticket bought. Some of those buyers clicked first. Some only saw it. Each platform counts that differently, and the window is on every bar below.
What that works out to. The four tracked platforms delivered 9,919,422 impressions for $75,152, which is $7.58 per thousand, about three quarters of a cent each. The 296 screens added another 923,911 for $7,736, and those are the vendor’s estimate of who walked past rather than a count. Impressions are not people: a smaller number of Nashvillians saw these ads many times each.
$574,063 is the sum of what four platforms each claim about themselves, on four different rulebooks. A buyer who saw an Instagram post, searched your name, then clicked a banner can be counted by all three. That overlap is real and we cannot remove it from platform data alone. The de-duplicated figure would be lower. Getting it needs one source that sees every order, which is exactly what connecting Ticketmaster properly next year gives us.
Not every channel is measured the same way, so the attribution window is noted on each.
Meta and TikTok are the missing bar. They took $52,162, the biggest share of the budget, and the dashboard reports their revenue only inside the combined total. Backing the named channels out leaves roughly $183,468 against that spend, about 3.5 times back. We show it because leaving it out lets the chart imply Google was the only thing working.
Read the windows, not just the numbers. Google's 2,095% counts anyone who saw or clicked an ad within 30 days of buying, which is a generous rule. Programmatic's 434% counts a 1 day view and 7 day click, a much harder test to pass, so those two are not directly comparable. Bandsintown sits outside the tracked four and is measured by Google Analytics instead, turning $2,245 into $22,256 through 231,600 email alerts to people already following these artists. Each platform also counts a buyer it touched as its own, so adding them up will overstate the total. The $574,063 is the four-platform figure, not a sum of these three.
$3,361,913
What the building took in
31,751 tickets · 89% of them sold before the doors opened
Switch the measure with the first row, show or hide a platform with the second. One view instead of nine separate chapters.
USE THE BUTTONS TO SHOW OR HIDE A PLATFORM · TAP A BAR FOR THE DETAIL
Where a number is missing, it says so. Meta and TikTok revenue sit inside a combined figure the dashboard does not split, and billboards cannot report a ticket sale at all. Those read as not measured rather than as zero, because a zero would make a working channel look like a failure. That distinction is the difference between a report that informs and one that quietly misleads.
Ticket campaigns follow a known shape. The grey band on each row is where the industry normally lands. The bar is where Music City Rodeo actually landed.
SOURCE: TICKETMASTER, VIA THE 2025 PHASE REPORT. THE FOUR PHASES SUM TO 31,778 AGAINST A STATED SEASON TOTAL OF 31,751, A 27 TICKET DIFFERENCE IN THE SOURCE DATA WE HAVE NOT RECONCILED.
What this says. The launch beat the industry range and the last stretch ran 12% against a 5 to 10 range. Over 13,000 tickets went in the first week, and another 3,817 sold across the final five days. The soft spot was the middle, seven weeks that delivered 23% when the range is 30 to 50. That is the single clearest thing to fix next year, and it is a scheduling problem more than a spending one.
Tickets, ad spend, weather and every activity that could move them, on one axis you can scale from a single day out to the whole season. Email and SMS sends, social posts, press pickup, price steps, show nights. Tap or hover any point to see what happened. Turn any layer off in the key.
MEASURED: RAIN, TEMPERATURE, SHOW DATES, ON SALE · MODELLED TO REAL TOTALS: TICKETS, AD SPEND · EXAMPLE PLACEMENT: EMAIL, SMS, SOCIAL, PRESS
What the weather does and does not explain. Between March 13 and April 30, the seven weeks that delivered 23% against a 30 to 50 benchmark, Nashville took 11.33 inches of rain, including five of the eight wettest days of the campaign. That is real recorded weather. But we are not going to hand you rain as the reason: bad weather keeps people out of a fairground, it does not stop anyone buying a Reba ticket from the sofa. The honest read is that April was quiet because nothing was scheduled to happen in April. No new on sale, no price step, no announcement. The weather is context. The empty calendar is the cause.
Honest note on this chart. The weather, the show nights, the on sale date and the four phase totals are real. Two campaign markers and the artist announce marker are placed as examples of what the layer carries. The daily sales line is a modelled shape that adds up to those real phase totals exactly, because daily sales were not in the file we were working from. Once the ticketing feed is connected this line is the real thing, and every press hit, content post, price step and artist announcement drops onto the same axis as a marker you can tap.
A number on its own is a verdict. The same number next to the rest of the market is a fact. It needs a whole book of events to calculate, which is why you rarely see it.
PLACEHOLDER · EVERY POSITION ON THIS CHART IS INVENTEDWhat this is and is not. None of these dots are real yet. It is a picture of a comparison we cannot make until the whole book of events is connected, shown here so you know what is coming. When it is real it will place this event honestly, whether that lands above the line or below it. A version of this chart that only ever flatters the client is worth nothing to either of us.
13,945
Tickets in the first seven days
44% of the entire year · before any tracking existed
Within 5% of each other on tickets. Not on money: Reba’s night made 78% of what Jelly Roll’s did.
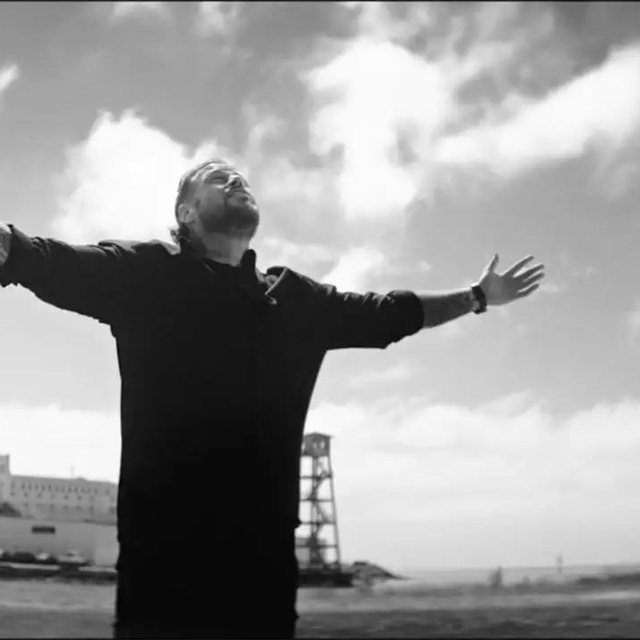
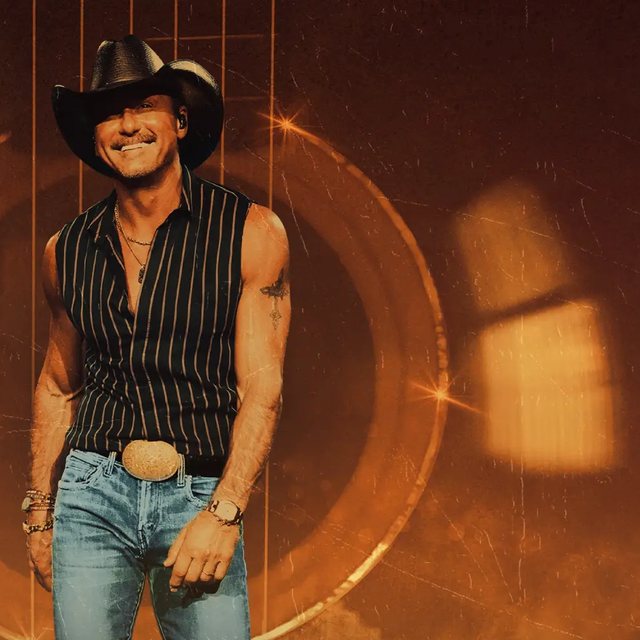
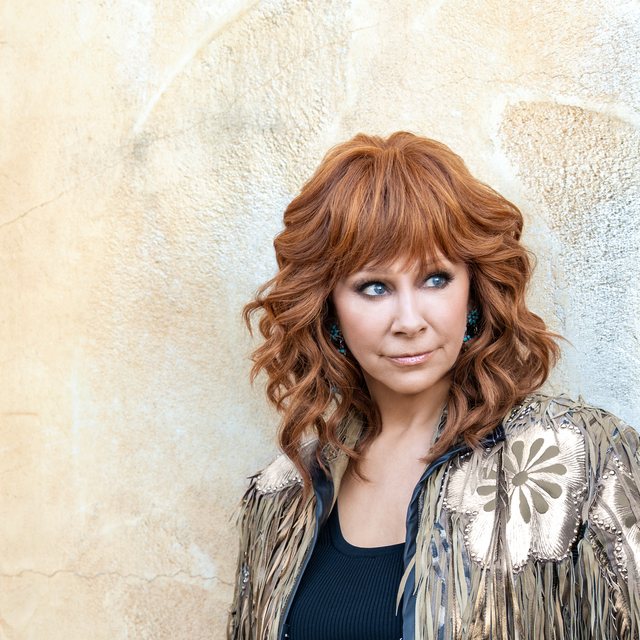
Read the gap. McGraw sold more tickets than Jelly Roll and made less money, because the average seat went for less. If the goal next year is revenue rather than attendance, that difference is where the pricing conversation starts.
Seven channels. Facebook and Instagram took half of it. Google was the one that paid.
Google was the efficiency story. $17,507 in, and search plus Performance Max were credited with roughly $366,800 in ticket revenue between them. That is a twenty to one return on the smallest major line in the budget, and the strongest argument for putting more there next year.
Half of what an ad budget buys is the ad. These ran on Meta, TikTok, display and out of home across the campaign.
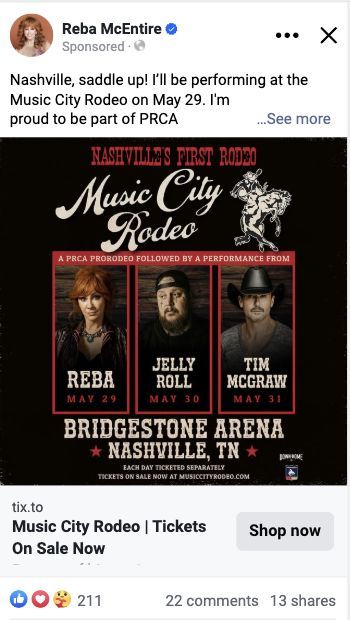
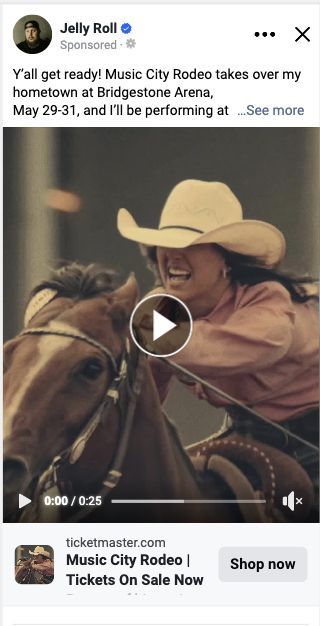
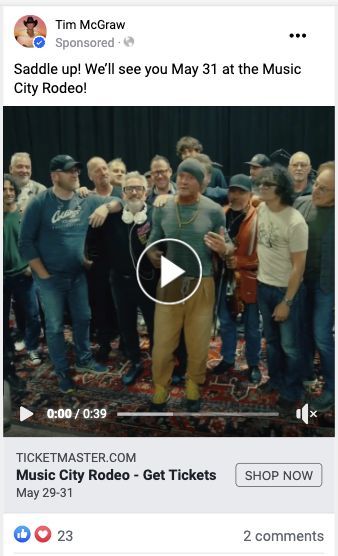
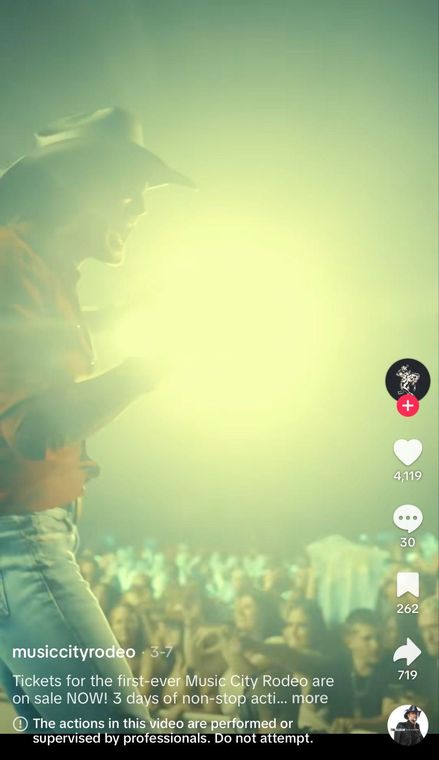
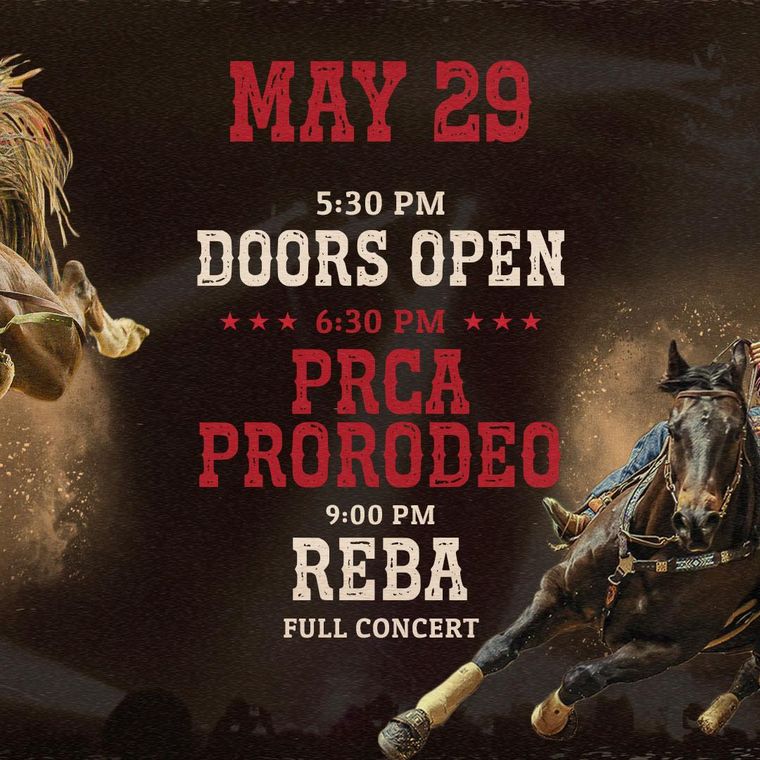
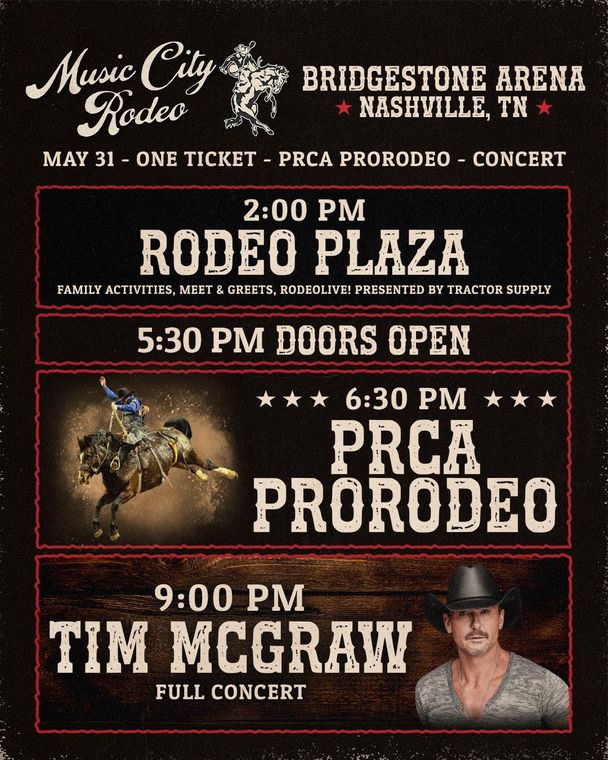
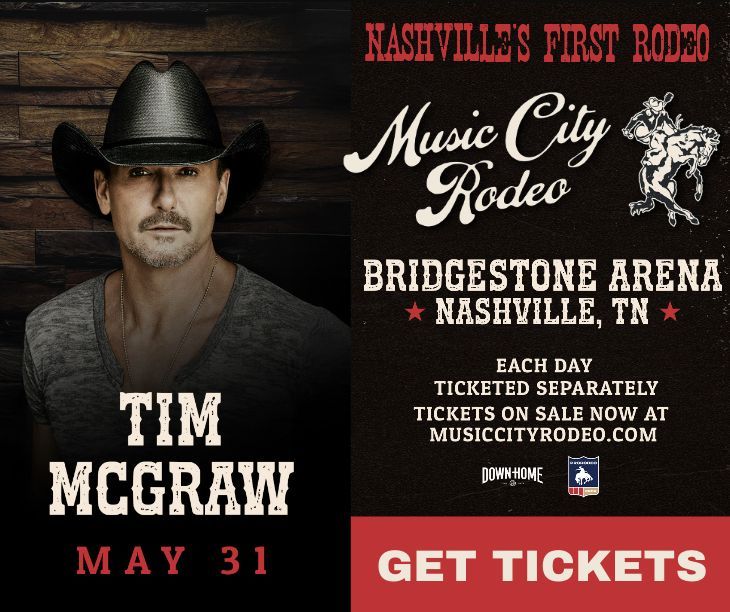
This is the part that does not show up in a spend table. Those three ads ran as posts from the artists' own verified accounts, not from the rodeo's page. A fan scrolling past sees Reba telling them she is playing, not a brand telling them to buy. It is the single biggest reason the artist campaigns outperformed everything else, and it takes relationships to arrange rather than budget.
The targeting is the other half of the work, and it never shows up in a spend table either.
Lists of people a provider already knows buy country concert tickets, and people recorded attending a live rodeo. Not guesses about who might like one.
ACXIOM · TICKET PURCHASERSNRG · RODEO ATTENDANCE123PUSH · SEASONAL EVENTSPhones that were physically at rodeo and country events in the months before. The clearest signal there is, because it is behaviour rather than an interest tick box.
FRANKLIN RODEOPBR AT BRIDGESTONEKANE BROWN SHOWPREDATORS JELLY ROLL NIGHTLocal news and country media first, national news and weather second. Where a Nashville rodeo buyer spends their morning, not where a media plan says they should be.
TENNESSEANNEWSCHANNEL 5FOX 17TASTE OF COUNTRYWEATHER.COMCNN296 digital boards, bought by auction rather than on a contract, so bids moved with location, time of day and the weather. The budget was split exactly in half between two kinds of screen, which makes this a clean test.
Same money, very different result. $3,868 went to big downtown billboards and $3,868 went to screens inside food halls, bars and restaurants at Fifth + Broadway. The food hall screens played the ad 4.3 times more often, reached 23% more people, and cost $7.60 per thousand against $9.33.
What to do with that. People walk past a billboard. They sit in a bar. The same dollar buys far more time in front of someone who is already downtown with a drink in their hand, and that is exactly the person buying a rodeo ticket. Next year the split should not be even.
What this does and does not tell you. Nine in ten bought online. That is where people bought, not why. Radio, press, the artists’ own announcements and word of mouth all end at the same checkout page. What it does mean is that the buying happened somewhere we can see it, and that you now hold buyer records for most of the room.
Worth a second look. The 3,432 people who bought at the window paid $121.84 a ticket. The 28,319 who bought online paid $103.95. Walk-up buyers spent 17% more per seat, and nobody is marketing to them.
The campaign built an audience you can reach directly next year without paying a platform for permission.
This is the asset. Fifteen email campaigns went out, 108,131 emails, opened at 12.8%. Next year that list exists on day one. Announcing to people who already raised their hand costs a fraction of what it costs to find them cold, and it is the main reason a second year should be cheaper per ticket than a first.
$2.74
Advertising cost per ticket sold
2.6% of gross ticket revenue
Conversion tracking went live in Ticketmaster on March 17. The on sale week ran March 5 to 12 and moved 13,945 tickets, which is 44% of everything sold all year. None of that revenue is credited to any ad platform, because there was nothing in place yet to credit it.
We are flagging it rather than quietly reporting the smaller number. What we are not going to do is tell you the real return is therefore much higher. On sale week is when three arena headliners get announced at once and demand is at its easiest, so some of those 13,945 tickets would have sold with no advertising at all. Nobody can say how many, us included. Next year the pixel goes in before the announcement and we stop guessing.
Every figure on this page is queryable. It answers in tickets, nights and dollars, because a tool that answers in click through rate cannot tell you anything useful about a rodeo eight weeks out.
Why this is not the usual chatbot. The one bolted onto most reporting tools talks about CTR and CPM, and treats a cost per acquisition as if it should be stable. On a ticketing campaign it is not: it climbs as the event gets close and the easy buyers are gone. Anything that does not know that gives advice worth ignoring, which is why nobody opens it. This one is built on how tickets actually sell.
In the order we would do it.
A "be the first to know" page, an early ticket giveaway, and recap content pushing signups. Announcing into a warm list makes on sale day cheaper and bigger.
Seven weeks delivered 23% when the range is 30 to 50. That window needs something in it. A price step, a new on sale, a content moment. Anything that gives people a reason to buy in April.
Everyone who bought through Ticketmaster, segmented by night and ticket type. Right now they are in the ticketing system and not in the place you send from.
Start low and step the price up as inventory drops and the date gets closer. Use this year's photography to make the upgrade feel worth it.
The single cheapest fix on this list. It costs nothing and it is the difference between reporting the whole year and reporting most of it.
Engagement spiked on June 1 off eight champion posts layered on five earlier ones. One athlete collaboration alone reached 43,700 views with 91% of them non followers.